
|
Weird Science
Richard Dawkins is most well-known nowadays as the go-to atheist provocateur, though his fame was built upon his work as a biologist. "A Threshold Model of Choice Behaviour" was a 1969 paper he wrote while at Oxford University. In it he proposes a model for animal behaviour that he subsequently finds evidence for in other widespread applications.
The "choice behaviour" he specifically studied was the decision process undertaken by chicks when choosing whether to peck at a stimulus. He proposed that there was some kind of continuous variable inside the animal, fluctuating over time, so that when a certain threshold was reached, the animal would exhibit the behaviour. In a situation where a choice was to be made, the most preferred stimuli would have the lowest threshold. When the thresholds of more than one stimuli was reached, each of these stimuli had an equal (proportional?) chance of being chosen. For the chicks, the continuous fluctuating variable was some combination of hunger and curiosity and the stimulus were blue, red and green lights in differing, pairwise configurations. And in case you have leghorn chicks as pets and were wondering what they liked best, you'll be interested to know that they prefer blue over red, and red over green. That is, once the lowest threshold was reached, they pecked at blue. Once the next highest threshold was reached, they pecked at either blue or red. And finally, once the highest threshold was reached, they pecked at blue, red or green. His paper can be read here: http://richarddawkins.net/file/2014...e-behaviour.pdf, where he goes into quite a bit more detail regarding the designs for the different experiments he ran. Skipping all that, he proposed the following formula to model the behaviour:  The A, B and C subscripts refer to the different stimuli in descending order of preference. So, PAC is the proportion of responses that are for A when both A and C are presented, for example. Back to our chicks, the formula tells us by how much the model says they should prefer blue lights over green, if we know how much they prefer blue over red, and red over green. Obviously the model works reasonably well, else there wouldn't be a paper about it, nor would I make a post regarding it. He saw the same success when he applied it to data from different animal studies and - most notably - to human decision-making. The prediction from his model was extremely close to the observed data across subjects as diverse as preferred composers, handwriting, vegetables and colours.  *NB - there's a single dot missing from the chick graph that was so far off the line that when the typesetter saw it, they figured that it must have been a smudge and omitted it from the published version Betting is decision-making (with risk-reward/confidence), do we see the same behaviour in betting markets? And if we don't, is it an indication of the market getting it wrong in a specific instance? (Given that the market is accurate over the long-term, any errors would have to cancel themselves out). Winx, Black Heart Bart and He Or She were in a three-horse race recently. The on-track starting price odds were $1.25, $4.75 and $21, respectively. Ignoring the fave-longshot bias and just equally correcting for over-round, we get the following preferences for the racewinner: 75.6%, 19.9% and 4.5%. Using these figures, the probability that Winx is preferred over Black Heart Bart in a pairwise comparison is 75.6/(75.6+19.9) = 79.2%. The probability that Black Heart Bart is preferred over He Or She = 81.6%. Plugging these figures into the formula, the model predicts that Winx should be preferred over He Or She by 92.3%. The market prices indicates that it is 94.4% though. If the model does indeed apply here (and if the over-round is uniformly applied to each runner and if the market isn't subject to any biases in selection ala fave-longshot, etc), it implies that one or more of our probabilities are wrong. Either the preference for Winx in the population of bettors is underestimated (i.e. the price should be lower) or/and the preference for one or both of the other runners has been overestimated (i.e. their prices should be higher). If you use the solving tools in Excel, for example, to minimise the error between the observed and expected probabilities (perhaps limiting each choice so that they were within historical minimum/maximum prices for ranking-field size) you could determine the individual prices that best suited the model. (Without any limitations it said that Winx was a sure thing and you could write your own ticket for the other runners). I'm yet to discover how to do it for different race sizes and hold strong doubts regarding its applicability in any case, but found it interesting. As I find other tidbits from research papers I stumble across, I'll add them to this thread. |
So in other words "Random Chance"
Cheers darky |
Quote:
In either case, it might not be useless. Check out this chart:  As can be seen, the greater the difference in odds between the most-preferred and least-preferred horses (i.e. by how much the former is preferred to the latter in a pairwise comparison, the horizontal axis), the greater the difference between what the model predicts (the dots) and what the odds actually indicate. While possible that it's due to the model being incorrect, I personally think it likely it's the fave-longshot bias in effect: the odds of the outsider are shorter than what the market truly believes (as it's "only" a 3-horse race) and/or the favourite is longer than it should be (as it's adjudged not worth the risk of actual money being bet). The furthest dot to the right that's sitting on the line, looks kind of out of place. In that particular race the second and third favourite were of equal odds. Similarly, the other ones close to the line are when the first or second favourite are equal or very close to each other in the odds. So the rule of thumb could be: in a 3-horse race in which the runners are clearly ordered and 'spaced' in the market, bet on the favourite as you are likely getting overs. (Mind you, "overs" is only in the order of 2% or so - $1.38 vs $1.35 - you'd be much better off just shopping around for better odds). The model could help you determine the conditions under which the fave-longshot bias is evident, rather than having to collect tens of thousands of races to measure the effect. |
Great Post.
|
Quote:
|
I noted that there was 3-horse race in Hobart this afternoon, remembered this thread and went looking for it. It seems that the image host I used has changed domains so the accompanying pictures no longer display.
Of course it's far too late to edit the posts so, if anyone ever wanted to see the pictures referred to, here they are again (for now, at least). They're posted in the order they are referred to in the thread. They likely won't make much sense outside of the post context so scroll up if needed. 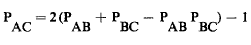  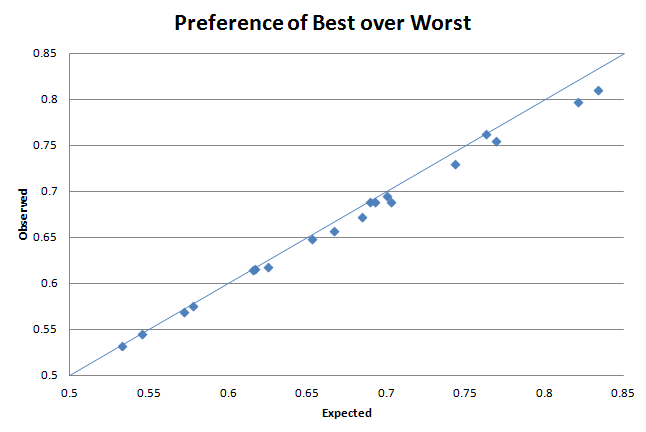 The market for today's Hobart race matched the rule of thumb: in a 3-horse race in which the runners are clearly ordered and 'spaced' in the market, bet on the favourite as you are likely getting overs. The fave won and you would've got 2-3% better odds than you should have done (whoopee! ;)), if the theory held. |
| All times are GMT +10. The time now is 10:42 AM. |
Powered by: vBulletin Version 3.0.3
Copyright ©2000 - 2024, Jelsoft Enterprises Ltd.