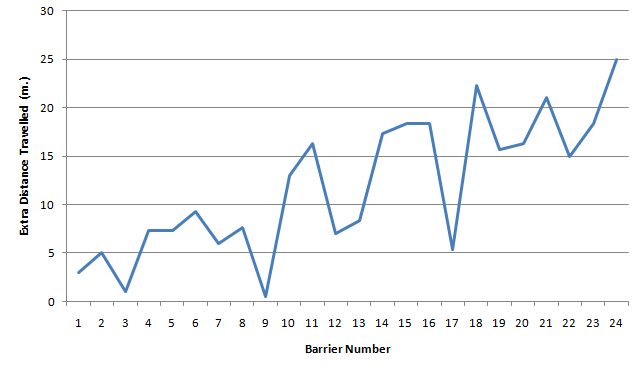
Here is the average extra distance each barrier runs (based on the last 3 years since information has been publicly available):
I posted the below in the 2018 thread regarding barriers and it seemed to work out somewhat last year as well:
Since 2000:
First
<=B15: 83.33%
>B15: 16.67%
Top 2
<=B15: 83.33%
>B15: 16.67%
Top 3
<=B15: 81.48%
>B15: 18.52%
Top 4
<=B15: 81.94%
>B15: 18.06%
Were it random chance, going by the average field size over the past 18 editions (excluding those who didn't complete the race), it should be:
<=B15: 66.17%
>B15: 33.83%
5th position is where the outer barrier's results start to catch up to expectation. For those finishing exactly 5th, it's 50-50 whether they were drawn outside barrier 15 these past 18 years.
5th-7th: those in outside barriers are over-represented
<=B15: 55.46%
>B15: 44.44%
8th-14th: it seems to swing back
<=B15: 72.22%
>B15: 27.88%
remainder: and back again
<=B15: 56.41%
>B15: 43.52%
Does it go in the placings: good inside horses over-represented, then good outside horses over-represented, then dodgy inside horses over-represented, then dodgy outside horses over-represented?
What kind of outside-drawn horses overcome their misfortune and finish top-4? The 3 winners within the sample were <= 52kg. 11 of the 13 top-4 finishers were also <= $21 despite their draw.
Of the 140 finishers drawn outside barrier 15, the <= $21 rule eliminates 99 candidates and misses 1 second and 1 third (Jakkalberry and Red Cadeaux). Weight <= 54kg elimates a further 12 for no further top-4 misses.
The above might help with some borderline First-4 selections after the barrier draw...